Multiple Choice
Refer to the following breakdown of responses to a survey of "How confident are you that you saved enough to retire"? 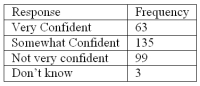 What is the class interval for the frequency table above?
A) 10
B) 20
C) 40
D) None of the above
Correct Answer:

Verified
Correct Answer:
Verified
Related Questions
Q33: To construct a pie chart, the class
Q55: In a bar chart, the x-axis is
Q64: A frequency polygon is a very useful
Q99: A small sample of computer operators shows
Q119: Refer to the following breakdown of responses
Q122: Refer to the following breakdown of responses
Q125: A _ chart is useful for displaying
Q127: Refer to the following information from a
Q128: Refer to the following breakdown of responses
Q129: For the following distribution of heights, what