Multiple Choice
Refer to the following breakdown of responses to a survey of "How confident are you that you saved enough to retire"? 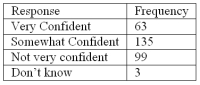 What type of chart should be used to show relative class frequencies?
A) Pie chart
B) Bar chart
C) Histogram
D) Frequency Polygon
Correct Answer:

Verified
Correct Answer:
Verified
Q13: A _ chart is useful for displaying
Q49: When data is collected using a qualitative,
Q50: A student was interested in the cigarette
Q51: Refer to the following information from a
Q52: Refer to the following distribution: <img src="https://d2lvgg3v3hfg70.cloudfront.net/TB2538/.jpg"
Q53: In a deck of cards, a class
Q55: Refer to the following distribution of ages:
Q56: The following frequency distribution shows the distribution
Q58: Refer to the following class marks or
Q59: The following frequency distribution shows the distribution