Short Answer
The following frequency distribution shows the distribution of delivery times (in days) for swimstuff.com customer orders during the last month. 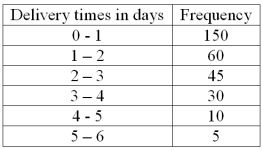 How many orders were delivered in less than three days?
Correct Answer:

Verified
Correct Answer:
Verified
Related Questions
Q13: A _ chart is useful for displaying
Q51: Refer to the following information from a
Q52: Refer to the following distribution: <img src="https://d2lvgg3v3hfg70.cloudfront.net/TB2538/.jpg"
Q53: In a deck of cards, a class
Q54: Refer to the following breakdown of responses
Q55: Refer to the following distribution of ages:
Q58: Refer to the following class marks or
Q59: The following frequency distribution shows the distribution
Q60: What is the number of observations in
Q77: In a bar chart, why are there