Multiple Choice
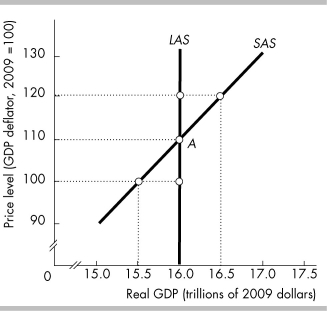
-In the figure above, potential GDP equals
A) $15.5 trillion.
B) $16.0 trillion.
C) $16.5 trillion.
D) None of the above answers is correct.
Correct Answer:

Verified
Correct Answer:
Verified
Q33: <img src="https://d2lvgg3v3hfg70.cloudfront.net/TB8586/.jpg" alt=" -From the data
Q54: The short-run aggregate supply curve is upward
Q60: The aggregate demand curve shows that, if
Q160: The Great Depression, in which real GDP
Q161: Which of the following shifts both the
Q211: What happens if the economy is at
Q288: <img src="https://d2lvgg3v3hfg70.cloudfront.net/TB8586/.jpg" alt=" -The above figure
Q336: Which of the following changes does NOT
Q376: The aggregate demand curve<br>A) has a negative
Q382: <img src="https://d2lvgg3v3hfg70.cloudfront.net/TB8586/.jpg" alt=" -In the above