Multiple Choice
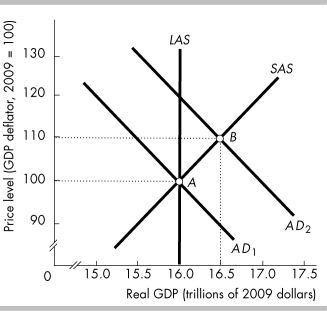
-In the above figure, the aggregate demand curve is AD?, so the short-run equilibrium level of real GDP is
A) $16 trillion.
B) $16.5 trillion.
C) more than $16 and less than $16.5 trillion.
D) None of the above answers is correct.
Correct Answer:

Verified
Correct Answer:
Verified
Q19: Which of the following shifts the aggregate
Q76: <img src="https://d2lvgg3v3hfg70.cloudfront.net/TB8586/.jpg" alt=" -The curve labeled
Q154: <img src="https://d2lvgg3v3hfg70.cloudfront.net/TB8586/.jpg" alt=" -Based on the
Q168: In the figure above, the economy is
Q172: <img src="https://d2lvgg3v3hfg70.cloudfront.net/TB3035/.jpg" alt=" -In the above
Q174: In 2009, just after taking office, President
Q186: A change in _ results in a
Q196: <img src="https://d2lvgg3v3hfg70.cloudfront.net/TB8586/.jpg" alt=" -The above figure
Q325: How are potential GDP, full employment and
Q373: The short-run aggregate supply curve<br>A) is vertical.<br>B)