Essay
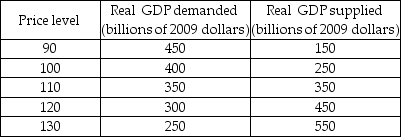
-The table above shows Yellowland's economy aggregate demand and supply schedules. Yellowland's potential GDP is $300 billion.
a) Plot the aggregate demand curve, the short-run aggregate supply curve, and the long-run aggregate supply curve.
b) What are the short-run equilibrium real GDP and price level in Yellowland?
c) What is the long-run equilibrium real GDP?
d) Is Yellowland's short-run macroeconomic equilibrium a full-employment equilibrium, below full-employment equilibrium, or above full-employment equilibrium? What is the recessionary gap (if any)? What is the inflationary gap (if any)?
e) Suppose aggregate supply decreases by $150 billion. Plot the new aggregate supply curve. How do real GDP and the price level change in the short run?
f) Is Yellowland's new short-run macroeconomic equilibrium a full-employment equilibrium, below full-employment equilibrium, or above full-employment equilibrium? What is the recessionary gap (if any)? What is the inflationary gap (if any)?
Correct Answer:

Verified
 a) See the figure above. The short-run ...
View Answer
Unlock this answer now
Get Access to more Verified Answers free of charge
Correct Answer:
Verified
View Answer
Unlock this answer now
Get Access to more Verified Answers free of charge
Q150: The land of Mordor increases its capital
Q151: The aggregate demand curve shows the _
Q152: Which of the following can be said
Q153: <img src="https://d2lvgg3v3hfg70.cloudfront.net/TB8586/.jpg" alt=" -In the above
Q154: <img src="https://d2lvgg3v3hfg70.cloudfront.net/TB8586/.jpg" alt=" -Based on the
Q156: According to the intertemporal substitution effect, a
Q157: In long-run macroeconomic equilibrium, the<br>A) real wage
Q158: A decrease in government expenditure shifts the
Q159: Suppose the exchange rate falls from $1.20
Q160: The Great Depression, in which real GDP