Multiple Choice
Figure 3 depicts the: 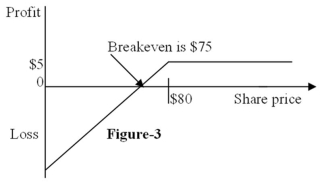
A) position diagram for the writer (seller) of a call option.
B) profit diagram for the writer (seller) of a call option.
C) position diagram for the writer (seller) of a put option.
D) profit diagram for the writer (seller) of a put option.
Correct Answer:

Verified
Correct Answer:
Verified
Related Questions
Q7: Buying the stock and the put option
Q12: Suppose the underlying stock pays a dividend
Q14: The writer of a put option loses
Q31: An American call option gives its owner
Q50: A profit diagram implicitly neglects the time
Q54: Explain the main differences between position diagrams
Q56: The value of a call option increases
Q57: All else equal, as the underlying stock
Q66: Relative to the underlying stock, a call
Q73: All else equal, options written on volatile