Multiple Choice
Figure 8-11 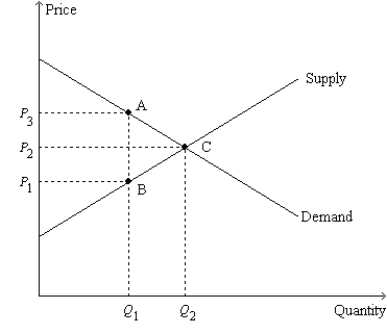
-Refer to Figure 8-11.The price labeled as P1 on the vertical axis represents the price
A) received by sellers before the tax is imposed.
B) received by sellers after the tax is imposed.
C) paid by buyers before the tax is imposed.
D) paid by buyers after the tax is imposed.
Correct Answer:

Verified
Correct Answer:
Verified
Q73: Figure 8-6<br>The vertical distance between points A
Q74: Figure 8-11 <img src="https://d2lvgg3v3hfg70.cloudfront.net/TB2297/.jpg" alt="Figure 8-11
Q75: Figure 8-3<br>The vertical distance between points A
Q76: Figure 8-9<br>The vertical distance between points A
Q77: A tax levied on the sellers of
Q79: Figure 8-8<br>Suppose the government imposes a $10
Q80: The supply curve for whiskey is the
Q81: Deadweight loss is the<br>A)decline in total surplus
Q82: Figure 8-6<br>The vertical distance between points A
Q83: When a tax is levied on buyers,the<br>A)supply