Multiple Choice
Figure 8-20. The figure represents the relationship between the size of a tax and the tax revenue raised by that tax.
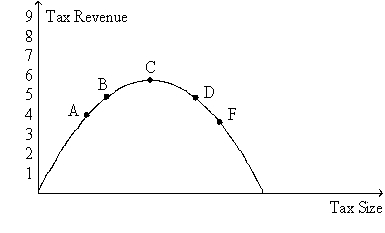
-Refer to Figure 8-20.For an economy that is currently at point D on the curve,a decrease in the tax rate would
A) decrease consumer surplus.
B) decrease producer surplus.
C) increase tax revenue.
D) increase the deadweight loss of the tax.
Correct Answer:

Verified
Correct Answer:
Verified
Q25: The higher a country's tax rates,the more
Q30: Figure 8-6<br>The vertical distance between points A
Q35: The view held by Arthur Laffer and
Q37: Taxes cause deadweight losses because they prevent
Q43: The less freedom people are given to
Q86: Relative to a situation in which gasoline
Q135: Figure 8-5<br>Suppose that the government imposes a
Q165: Figure 8-6<br>The vertical distance between points A
Q186: Scenario 8-1<br>Erin would be willing to pay
Q388: Figure 8-7<br>The vertical distance between points A