Multiple Choice
The Hertzsprung-Russell diagram (figure below) is: 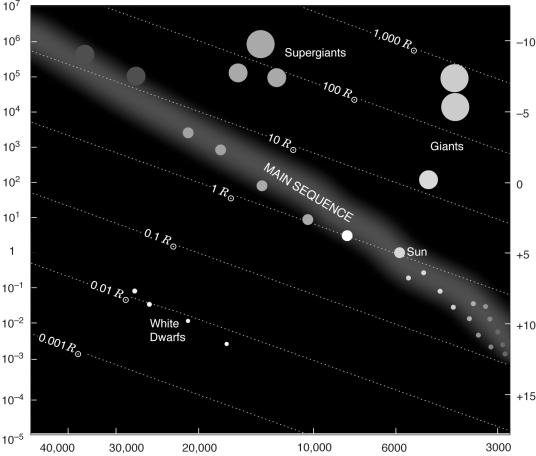
A) a graph of mass versus brightness for stars
B) a graph of size versus mass for stars
C) a graph of surface temperature versus luminosity for stars
D) a graph of mass versus spectral type for stars
Correct Answer:

Verified
Correct Answer:
Verified
Related Questions
Q4: Two similar stars have the same temperature.If
Q7: The spectrum in the figure below is:
Q8: In a binary star system that
Q12: Why do we see black lines in
Q14: The emission and absorption lines of a
Q22: What is the difference between brightness and
Q28: All of the following are useful in
Q56: Which sequence correctly lists the spectral classes
Q57: A parsec is a unit of time.
Q74: Explain how we can use spectroscopic parallax