Multiple Choice
The table below shows hypothetical prices for a particular anatomy textbook at a university bookstore over several years.
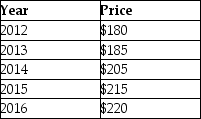 TABLE 2-4
-Refer to Table 2-4.The increase in the price of the textbook from 2012 to 2016 is
A) -40.
B) 40.
C) 18.2%.
D) 22.2%.
E) 40%.
Correct Answer:

Verified
Correct Answer:
Verified
Q4: Which of the following statements belongs more
Q6: The table below shows hypothetical per-minute cell
Q7: The table below shows the approximate value
Q10: Figure 2-5 shows monthly average (per unit)production
Q13: <img src="https://d2lvgg3v3hfg70.cloudfront.net/TB5441/.jpg" alt=" FIGURE 2-2 -Refer
Q16: The table below shows hypothetical data for
Q27: On a coordinate graph with y on
Q47: An economist has data showing household income
Q116: Which is the best description of positive
Q147: When an increase in one variable is