Multiple Choice
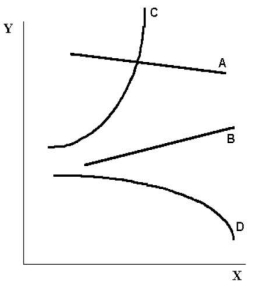 FIGURE 2-2
-Refer to Figure 2-2.The slope of curve C is
A) positive and constant.
B) negative and constant.
C) positive and changing.
D) negative and changing.
E) impossible to describe.
Correct Answer:

Verified
Correct Answer:
Verified
Related Questions
Q4: Which of the following statements belongs more
Q10: Figure 2-5 shows monthly average (per unit)production
Q11: The table below shows hypothetical prices for
Q16: The table below shows hypothetical data for
Q17: The table below shows hypothetical data for
Q18: The table below shows hypothetical prices for
Q27: On a coordinate graph with y on
Q47: An economist has data showing household income
Q116: Which is the best description of positive
Q147: When an increase in one variable is