Multiple Choice
The table below shows the approximate value of Canada's crude oil and natural gas exports over a 5-year period.The amounts shown are billions of dollars.
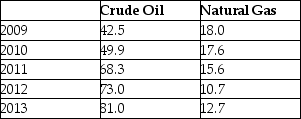 TABLE 2-7
-Refer to Table 2-7.Assume that 2009 is the base year,with an index number = 100.What is the percentage change in the value of exports of natural gas from 2009 to 2013?
A) 71
B) -71%
C) 71%
D) 29%
E) -29%
Correct Answer:

Verified
Correct Answer:
Verified
Q24: If a theory's prediction is tested and
Q56: An economist collects data comparing per-capita expenditures
Q57: In a co-ordinate graph,with Y on the
Q59: <img src="https://d2lvgg3v3hfg70.cloudfront.net/TB5441/.jpg" alt=" FIGURE 2-2 -Refer
Q60: <img src="https://d2lvgg3v3hfg70.cloudfront.net/TB5441/.jpg" alt=" FIGURE 2-3 -Refer
Q61: Suppose an individual wheat farmer's income is
Q62: Suppose that a particular theory predicts that
Q63: The table below shows hypothetical tuition costs
Q65: The table below shows hypothetical per-minute cell
Q95: Suppose there is a theory that several