Multiple Choice
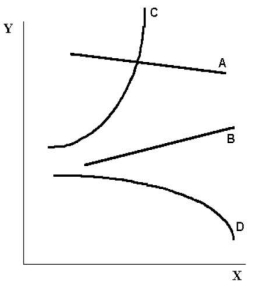 FIGURE 2-2
-Refer to Figure 2-2.The slope of curve D is
A) positive and constant.
B) negative and constant.
C) positive and changing.
D) negative and changing.
E) undefined.
Correct Answer:

Verified
Correct Answer:
Verified
Related Questions
Q2: Suppose there is a linear relationship between
Q24: If a theory's prediction is tested and
Q55: The base year for an index number
Q56: An economist collects data comparing per-capita expenditures
Q57: In a co-ordinate graph,with Y on the
Q60: <img src="https://d2lvgg3v3hfg70.cloudfront.net/TB5441/.jpg" alt=" FIGURE 2-3 -Refer
Q61: The table below shows the approximate value
Q62: Suppose that a particular theory predicts that
Q63: The table below shows hypothetical tuition costs
Q95: Suppose there is a theory that several