Multiple Choice
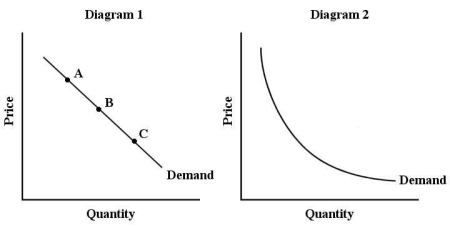 FIGURE 4-1
-Refer to Figure 4-1,which shows two demand curves,one linear and the other a rectangular hyperbola.In diagram 1,the price elasticity of demand
A) at point A is equal to that at point C.
B) at point A is less than at point C.
C) at point A is greater than at point C.
D) is equal at points A,B,and C.
E) at point A is equal to that at point B.
Correct Answer:

Verified
Correct Answer:
Verified
Q144: Consider the following data for a hypothetical
Q145: If the price elasticity of demand for
Q146: What does the following statement imply about
Q147: <img src="https://d2lvgg3v3hfg70.cloudfront.net/TB5441/.jpg" alt=" FIGURE 4-2 -Refer
Q148: <img src="https://d2lvgg3v3hfg70.cloudfront.net/TB5441/.jpg" alt=" FIGURE 4-2 -Refer
Q150: If the income elasticity of demand for
Q151: What does the following statement imply about
Q152: Producers will bear a larger burden of
Q153: Suppose empirical analysis concludes that the income
Q154: <img src="https://d2lvgg3v3hfg70.cloudfront.net/TB5441/.jpg" alt=" FIGURE 4-3 -Refer