Multiple Choice
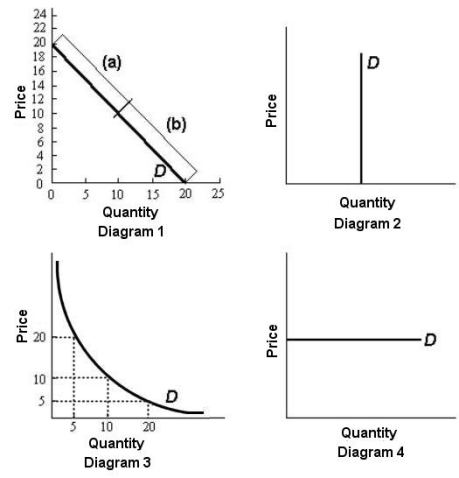 FIGURE 4-2
-Refer to Figure 4-2.In diagram 1,the elasticity of demand over the price range $14 to $16 is
A) 0.
B) less than 1.
C) 1.
D) greater than 1.
E) infinity.
Correct Answer:

Verified
Correct Answer:
Verified
Related Questions
Q142: Suppose that the quantity demanded of skipping
Q143: Suppose a market is in equilibrium at
Q144: Consider the following data for a hypothetical
Q145: If the price elasticity of demand for
Q146: What does the following statement imply about
Q148: <img src="https://d2lvgg3v3hfg70.cloudfront.net/TB5441/.jpg" alt=" FIGURE 4-2 -Refer
Q149: <img src="https://d2lvgg3v3hfg70.cloudfront.net/TB5441/.jpg" alt=" FIGURE 4-1 -Refer
Q150: If the income elasticity of demand for
Q151: What does the following statement imply about
Q152: Producers will bear a larger burden of