Multiple Choice
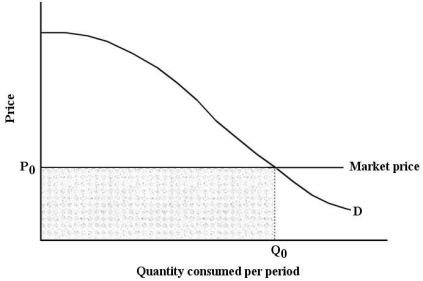 FIGURE 6-7
-Refer to Figure 6-7.Suppose that price is P0.Total consumer surplus is then given by the area
A) under the demand curve to the left of Q0.
B) below P0 and to the left of Q0.
C) under the demand curve to the left of Q0,but above P0.
D) under the entire demand curve.
E) above the market price.
Correct Answer:

Verified
Correct Answer:
Verified
Q10: Assume the quantity of good X is
Q11: Suppose the price of potatoes falls and
Q12: Consider the income and substitution effects of
Q13: Marginal utility theory is about<br>A)the consumer behaviour
Q14: If total utility from the consumption of
Q16: In indifference curve analysis,the consumer's utility-maximizing point
Q17: <img src="https://d2lvgg3v3hfg70.cloudfront.net/TB5441/.jpg" alt=" FIGURE 6-1 -Refer
Q18: Any consumption point that is on the
Q19: The table below shows the quantities of
Q20: As a consumer moves along an indifference