Multiple Choice
Diagrams A,B,and C show 3 individual consumers' demand curves for cement.Consumers A,B,and C constitute the entire monthly cement market in this region. 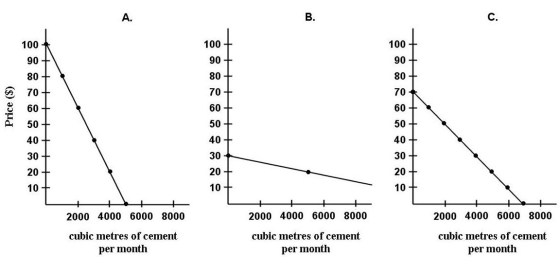 FIGURE 6-3
-Refer to Figure 6-3.What is the market demand (in cubic metres per month) for cement at a price of $80 per cubic metre?
A) 0
B) 1000
C) 2000
D) 3000
E) 4000
Correct Answer:

Verified
Correct Answer:
Verified
Q1: The figures below show Chris's consumption of
Q2: The table below shows the quantities of
Q3: The diagram below shows a set of
Q5: The table below shows the total value
Q6: Consumer surplus is<br>A)the sum of the marginal
Q7: Consider the income and substitution effects of
Q8: Consider the income and substitution effects of
Q9: <img src="https://d2lvgg3v3hfg70.cloudfront.net/TB5441/.jpg" alt=" FIGURE 6-7 -Refer
Q10: Assume the quantity of good X is
Q11: Suppose the price of potatoes falls and