Multiple Choice
The figures below show Chris's consumption of specialty coffee per week. 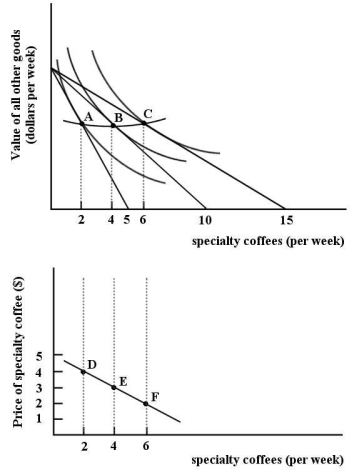 FIGURE 6-10
-Refer to Figure 6-10.The line connecting points A,B and C is ________.The line connecting points D,E and F is ________.
A) the price-consumption line; the demand curve
B) the income-consumption line; the demand curve
C) the income-consumption line; the budget line
D) the budget line; the price-consumption line
E) the demand curve; the budget line
Correct Answer:

Verified
Correct Answer:
Verified
Q2: The table below shows the quantities of
Q3: The diagram below shows a set of
Q4: Diagrams A,B,and C show 3 individual consumers'
Q5: The table below shows the total value
Q6: Consumer surplus is<br>A)the sum of the marginal
Q7: Consider the income and substitution effects of
Q8: Consider the income and substitution effects of
Q9: <img src="https://d2lvgg3v3hfg70.cloudfront.net/TB5441/.jpg" alt=" FIGURE 6-7 -Refer
Q10: Assume the quantity of good X is
Q11: Suppose the price of potatoes falls and