Multiple Choice
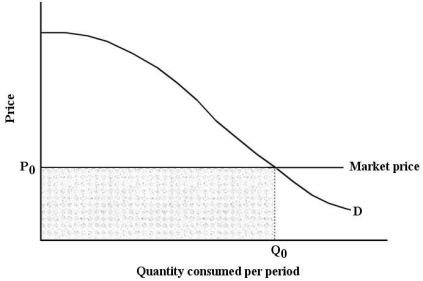 FIGURE 6-7
-Refer to Figure 6-7.Suppose that price is P0.The total value placed on all units of the commodity consumed is given by the area
A) under the demand curve to the left of Q0.
B) under the demand curve to the left of Q0,but above P0.
C) below P0 and to the left of Q0.
D) under the demand curve and above P0.
E) under the demand curve and to the right of Q0.
Correct Answer:

Verified
Correct Answer:
Verified
Q119: The table below shows the quantities of
Q120: Suppose Arun consumes only 2 goods -
Q121: The figures below show Chris's consumption of
Q122: Given a typical downward-sloping demand curve in
Q123: Dave's Consumer Surplus on Movie Rentals per
Q125: The market demand curve is derived from<br>A)the
Q126: If consumption of an extra unit of
Q127: Assume you are consuming two goods,X and
Q128: If a consumer is faced with a
Q129: Suppose a utility-maximizing person consumes only two