Multiple Choice
The figures below show Chris's consumption of specialty coffee per week. 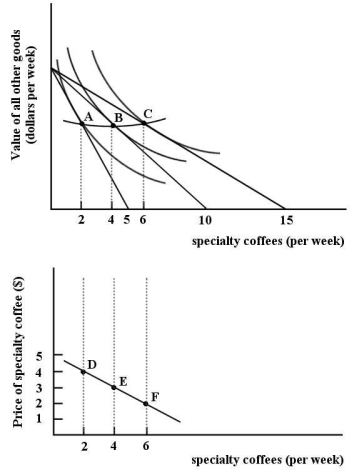 FIGURE 6-10
-Refer to Figure 6-10.In general,the absolute value of the slope of the budget lines is equal to
A) the relative price ratio (Pspecialty coffee/Pall other goods) .
B) the relative price ratio (Pall other goods/Pspecialty coffee) .
C) the quantity of all other goods consumed divided by the quantity of specialty coffees consumed.
D) $15/value of all other goods.
E) the dollar value of all other goods divided by the number of specialty coffees consumed per week.
Correct Answer:

Verified
Correct Answer:
Verified
Q116: Economists use the term "marginal utility" to
Q117: A consumer maximizes his or her utility
Q118: An individual's consumer surplus from some product
Q119: The table below shows the quantities of
Q120: Suppose Arun consumes only 2 goods -
Q122: Given a typical downward-sloping demand curve in
Q123: Dave's Consumer Surplus on Movie Rentals per
Q124: <img src="https://d2lvgg3v3hfg70.cloudfront.net/TB5441/.jpg" alt=" FIGURE 6-7 -Refer
Q125: The market demand curve is derived from<br>A)the
Q126: If consumption of an extra unit of