Multiple Choice
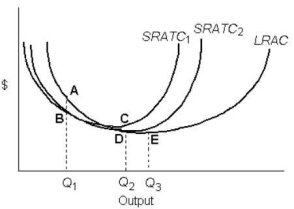 FIGURE 8-2
-Refer to Figure 8-2.Increasing returns to scale occur over the output range
A) 0 to Q1 only.
B) Q1 to Q2 only.
C) Q2 to Q3 only.
D) 0 to Q3 only.
E) beyond Q3 only.
Correct Answer:

Verified
Correct Answer:
Verified
Q97: Suppose a firm moves from one isoquant
Q98: Which of the following statements concerning long-run
Q99: <img src="https://d2lvgg3v3hfg70.cloudfront.net/TB5441/.jpg" alt=" FIGURE 8-1 -Refer
Q100: Which of the following is unlikely to
Q101: The long-run average cost curve is an
Q103: <img src="https://d2lvgg3v3hfg70.cloudfront.net/TB5441/.jpg" alt=" FIGURE 8-2 -Refer
Q104: In defining a firm's long-run average cost
Q105: TABLE 8-1<br> <img src="https://d2lvgg3v3hfg70.cloudfront.net/TB5441/.jpg" alt="TABLE 8-1
Q106: <img src="https://d2lvgg3v3hfg70.cloudfront.net/TB5441/.jpg" alt=" FIGURE 8-4 -Refer
Q107: A profit-maximizing firm will increase its use