Multiple Choice
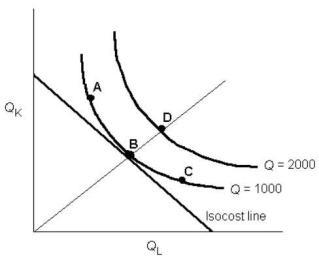 FIGURE 8-4
-Refer to Figure 8-4.The firm is initially producing 2000 units and minimizing its production cost at point D.Suppose the prices of capital and labour each rise by 10%.If the firm wishes to continue producing the same level of output it will
A) move toward point A.
B) move toward point B.
C) move toward point C.
D) remain at point D.
E) move to the right of point D.
Correct Answer:

Verified
Correct Answer:
Verified
Q101: The long-run average cost curve is an
Q102: <img src="https://d2lvgg3v3hfg70.cloudfront.net/TB5441/.jpg" alt=" FIGURE 8-2 -Refer
Q103: <img src="https://d2lvgg3v3hfg70.cloudfront.net/TB5441/.jpg" alt=" FIGURE 8-2 -Refer
Q104: In defining a firm's long-run average cost
Q105: TABLE 8-1<br> <img src="https://d2lvgg3v3hfg70.cloudfront.net/TB5441/.jpg" alt="TABLE 8-1
Q107: A profit-maximizing firm will increase its use
Q108: Suppose that capital costs $10 per unit
Q109: Which of the following cost curves demonstrate
Q110: The fact that new methods to extract
Q111: "The bigger the volume,the lower the cost,and