Multiple Choice
The figure below shows the demand schedule and demand curve for a product produced by a single-price monopolist. 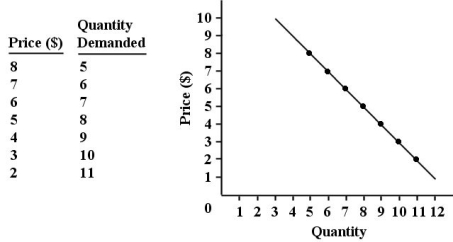 FIGURE 10-1
-Refer to Figure 10-1.Suppose this single-price monopolist is initially selling 5 units at $8 each and then reduces the price of the product to $6.By making this change,the firm is giving up revenue of ________ on the original number of units sold and gaining revenue of ________ on the additional units sold.Its marginal revenue is therefore ________.(All figures are dollars.)
A) 38; 40; 2
B) 8; 6; 2
C) 10; 12; 2
D) 14; 14; 0
E) 5; 7; -2
Correct Answer:

Verified
Correct Answer:
Verified
Q88: Consider the following statement: "Price discrimination is
Q89: Which one of the following cases is
Q90: Suppose a monopolist faces the demand curve
Q91: Economic profit for a monopolistic firm will
Q92: <img src="https://d2lvgg3v3hfg70.cloudfront.net/TB5441/.jpg" alt=" TABLE 10-1 -Refer
Q94: If a monopolist is practicing perfect price
Q95: The diagram below shows the demand curve
Q96: In November 2012,there was some discussion of
Q97: Suppose a monopolist faces the demand curve
Q98: A likely cause of a natural monopoly