Multiple Choice
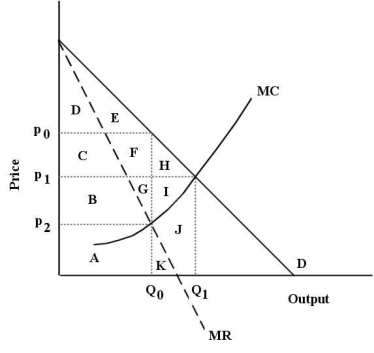
The diagram below shows the demand curve and marginal cost and marginal revenue curves for a new heart medication for which the pharmaceutical firm holds a 20-year patent on its production and sales.This protection gives the firm monopoly power for the 20 years of the patent.  FIGURE 10-6
-Refer to Figure 10-6.Assume this pharmaceutical firm has no fixed costs and is practicing perfect price discrimination among its buyers.At its profit-maximizing level of output,it will generate a total profit represented by
A) areas B + C + F + G + H + I.
B) areas C + F + H.
C) areas G + I.
D) the area below the demand curve minus the area below the MC curve,up to Q1.
E) It is not possible to determine with the information provided.
Correct Answer:

Verified
Correct Answer:
Verified
Q90: Suppose a monopolist faces the demand curve
Q91: Economic profit for a monopolistic firm will
Q92: <img src="https://d2lvgg3v3hfg70.cloudfront.net/TB5441/.jpg" alt=" TABLE 10-1 -Refer
Q93: The figure below shows the demand schedule
Q94: If a monopolist is practicing perfect price
Q96: In November 2012,there was some discussion of
Q97: Suppose a monopolist faces the demand curve
Q98: A likely cause of a natural monopoly
Q99: Which of the following is probably NOT
Q100: The demand curve facing a single-price monopolist