Multiple Choice
The diagram below shows total revenue for a single-price monopolist. 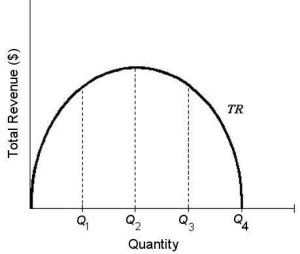 FIGURE 10-3
-Refer to Figure 10-3.The price elasticity of demand at Q3 is
A) zero.
B) less than 1.
C) equal to 1.
D) greater than 1.
E) not determinable from the diagram.
Correct Answer:

Verified
Correct Answer:
Verified
Q46: The diagram below shows the demand curve
Q47: A single-price monopolist is currently producing an
Q48: One similarity between a monopolist and a
Q49: Consider the following AR and MR curves
Q50: Suppose that a single-price monopolist knows the
Q52: If a monopolist's marginal revenue is MR
Q53: If a monopolist is practicing perfect price
Q54: The figure below shows the demand schedule
Q55: 10.3 Price Discrimination<br>Suppose a monopolist faces the
Q56: One reason movie theatres charge a lower