Multiple Choice
The figure below shows the demand schedule and demand curve for a product produced by a single-price monopolist. 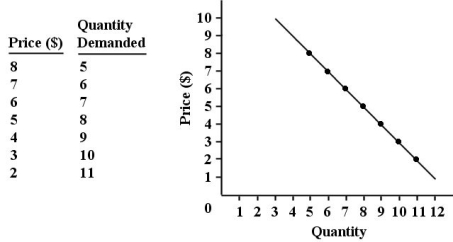 FIGURE 10-1
-Refer to Figure 10-1.Suppose this single-price monopolist is initially selling 9 units at $4 each and then reduces the price of the product to $3.By making this change,the firm is giving up revenue of ________ on the original number of units sold and gaining revenue of ________ on the additional units sold.Its marginal revenue is therefore ________.(All figures are dollars)
A) 40; 27; -13
B) 30; 36; 6
C) 34; 28; -6
D) 9; 3; -6
E) 3; 9; 6
Correct Answer:

Verified
Correct Answer:
Verified
Q49: Consider the following AR and MR curves
Q50: Suppose that a single-price monopolist knows the
Q51: The diagram below shows total revenue for
Q52: If a monopolist's marginal revenue is MR
Q53: If a monopolist is practicing perfect price
Q55: 10.3 Price Discrimination<br>Suppose a monopolist faces the
Q56: One reason movie theatres charge a lower
Q57: For a single-price monopolist,marginal revenue falls faster
Q58: The diagram below shows the demand curve
Q59: The diagram below shows the demand curve