Multiple Choice
The diagram below shows the demand curve facing a single-price monopolist. 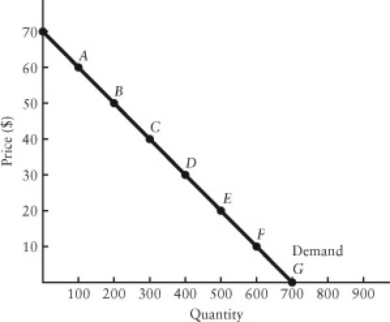 FIGURE 10-4
-Refer to Figure 10-4.What is the firm's marginal revenue per unit as it moves from point A to point B on the demand curve?
A) $0
B) $40
C) $50
D) $1000
E) $2000
Correct Answer:

Verified
Correct Answer:
Verified
Q54: The figure below shows the demand schedule
Q55: 10.3 Price Discrimination<br>Suppose a monopolist faces the
Q56: One reason movie theatres charge a lower
Q57: For a single-price monopolist,marginal revenue falls faster
Q58: The diagram below shows the demand curve
Q60: Suppose a monopolist faces the demand curve
Q61: <img src="https://d2lvgg3v3hfg70.cloudfront.net/TB5441/.jpg" alt=" TABLE 10-1 -Refer
Q62: The main argument of Joseph Schumpeter's idea
Q63: Your food-services company has been named as
Q64: A number of firms agreeing together to