Multiple Choice
The diagram below shows selected cost and revenue curves for a firm in a monopolistically competitive industry. 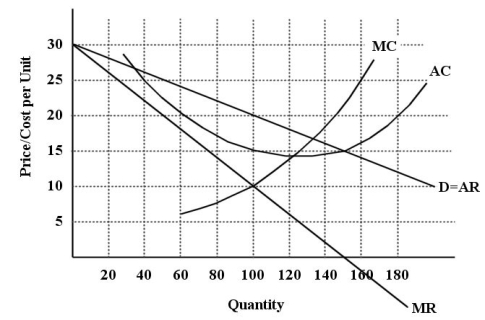 FIGURE 11-1
-Refer to Figure 11-1.Assuming this firm is producing its profit-maximizing level of output,what is the per-unit profit being earned by this firm?
A) -$5
B) -$10
C) $20
D) $10
E) $5
Correct Answer:

Verified
Correct Answer:
Verified
Q25: If there are economic profits in a
Q26: Which of the following statements is the
Q27: Suppose there are only two firms in
Q28: In a typical oligopolistic market,there are<br>A)no barriers
Q29: The table below shows the market shares
Q31: Suppose Proctor and Gamble introduces a new
Q32: The diagram below shows selected cost and
Q33: "Brand proliferation" in an oligopolistic industry<br>A)allows easier
Q34: <img src="https://d2lvgg3v3hfg70.cloudfront.net/TB5441/.jpg" alt=" FIGURE 11-2 -Refer
Q35: A good example of a monopolistically competitive