Multiple Choice
The diagram below shows selected cost and revenue curves for a firm in a monopolistically competitive industry. 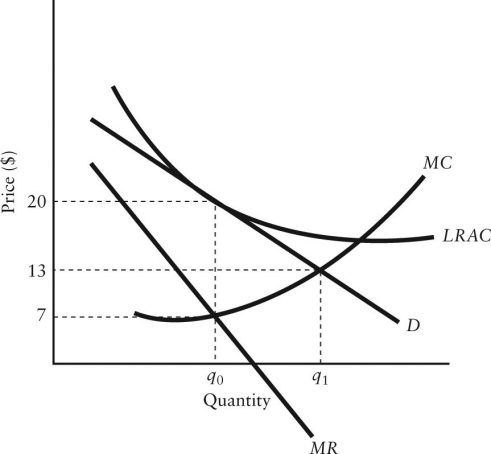 FIGURE 11-4
-Refer to Figure 11-4.How is the excess-capacity theorem demonstrated in this diagram?
A) The short-run equilibrium occurs where the firm is producing output at  ,which is less than that corresponding to the lowest point on its LRAC curve.
B) The long-run equilibrium occurs where the firm is producing output at  ,which is the same as for a perfectly competitive industry.
C) In long-run equilibrium the firm is earning positive profits,but has unexploited economies of scale.
D) In long-run equilibrium,this firm has excess capacity because they are selling output at a price below their LRAC.
E) The long-run equilibrium occurs where the firm is producing output at  ,which is less than that corresponding to the lowest point on its LRAC curve.
Correct Answer:

Verified
Correct Answer:
Verified
Q27: Suppose there are only two firms in
Q28: In a typical oligopolistic market,there are<br>A)no barriers
Q29: The table below shows the market shares
Q30: The diagram below shows selected cost and
Q31: Suppose Proctor and Gamble introduces a new
Q33: "Brand proliferation" in an oligopolistic industry<br>A)allows easier
Q34: <img src="https://d2lvgg3v3hfg70.cloudfront.net/TB5441/.jpg" alt=" FIGURE 11-2 -Refer
Q35: A good example of a monopolistically competitive
Q36: The demand curve facing a monopolistically competitive
Q37: In an oligopolistic industry,which of the following