Multiple Choice
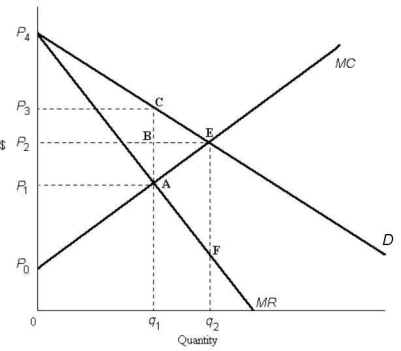 FIGURE 12-3
-Refer to Figure 12-3.Comparing the monopoly equilibrium to the perfectly competitive equilibrium,the area representing the gain in producer surplus due to monopoly is outlined by
A) P1P3CA less ACE.
B) P2P3CB less ABE.
C) P0P3CA less ACE
D) P3P4 less ABE.
E) P2P4E.
Correct Answer:

Verified
Correct Answer:
Verified
Q6: Consider three firms,A,B and C,all producing kilos
Q7: Allocative efficiency concerns<br>A)producing outputs at lowest possible
Q8: <img src="https://d2lvgg3v3hfg70.cloudfront.net/TB5441/.jpg" alt=" FIGURE 12-3 -Refer
Q9: Canadian governments (federal,provincial and municipal)employ public ownership
Q10: In many cases throughout Canadian history,governments have
Q12: The production possibilities boundary shows possible combinations
Q13: The diagram below shows supply,demand,and quantity exchanged
Q14: The diagram below shows the market demand
Q15: The diagram below shows supply,demand,and quantity exchanged
Q16: In Canada,the Competition Act specifies that in