Multiple Choice
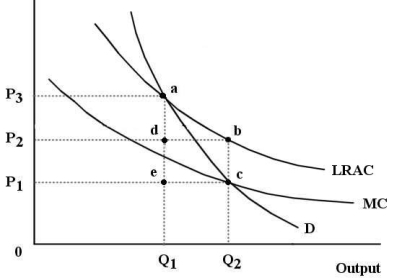
The diagram below shows the market demand curve and the cost curves for a single firm.  FIGURE 12-6
-Refer to Figure 12-6.Suppose this firm is being regulated using a policy of average-cost pricing.In this case,economic profits to the firm are represented by the area
A) P2P3ad.
B) P2P3ab.
C) 0P3aQ1.
D) P1P2bc.
E) There are no economic profits.
Correct Answer:

Verified
Correct Answer:
Verified
Q9: Canadian governments (federal,provincial and municipal)employ public ownership
Q10: In many cases throughout Canadian history,governments have
Q11: <img src="https://d2lvgg3v3hfg70.cloudfront.net/TB5441/.jpg" alt=" FIGURE 12-3 -Refer
Q12: The production possibilities boundary shows possible combinations
Q13: The diagram below shows supply,demand,and quantity exchanged
Q15: The diagram below shows supply,demand,and quantity exchanged
Q16: In Canada,the Competition Act specifies that in
Q17: In Canada,alleged violations of the Competition Act
Q18: The diagram below shows the demand and
Q19: In which of the following situations would