Multiple Choice
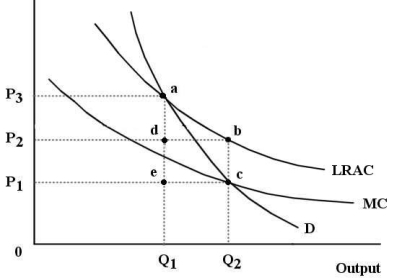
The diagram below shows the market demand curve and the cost curves for a single firm.  FIGURE 12-6
-Refer to Figure 12-6.Suppose this firm is being regulated using a policy of marginal-cost pricing.In this case,
A) allocative efficiency is achieved because profits are maximized.
B) the result is allocatively inefficient because the firm is suffering losses.
C) the result is allocatively inefficient because the firm is earning profits.
D) the result is allocatively inefficient because the marginal cost curve lies below the ATC curve.
E) allocative efficiency is achieved because price equals marginal cost.
Correct Answer:

Verified
Correct Answer:
Verified
Q35: In general,the sum of consumer and producer
Q36: In principle,a comparison of the long-run equilibrium
Q37: Suppose we compare two monopolists with identical
Q38: A regulated monopoly that faces rising long-run
Q39: Consider an industry with three profit-maximizing firms
Q41: The production possibilities boundary shows possible combinations
Q42: The diagram below shows the demand and
Q43: The diagram below shows cost and revenue
Q44: The diagram below shows the market demand
Q45: If a perfectly competitive industry was suddenly