Multiple Choice
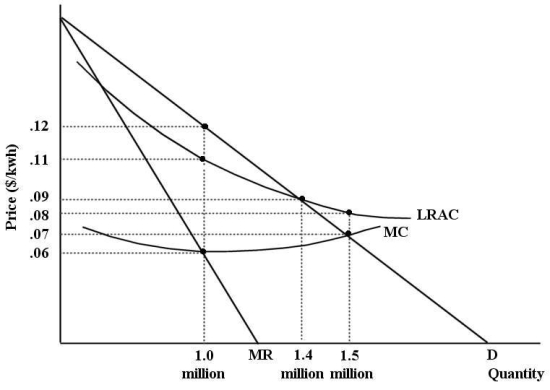
The diagram below shows cost and revenue curves for a natural monopoly producing electricity.Price is dollars per kilowatt hour and quantity is kilowatt hours per day.  FIGURE 12-7
-Refer to Figure 12-7.Suppose this firm is being regulated using a policy of marginal-cost pricing.In this case,economic profits are equal to
A) -$15 000.
B) -$28 000.
C) $0.
D) $90 000.
E) -$50 000.
Correct Answer:

Verified
Correct Answer:
Verified
Q38: A regulated monopoly that faces rising long-run
Q39: Consider an industry with three profit-maximizing firms
Q40: The diagram below shows the market demand
Q41: The production possibilities boundary shows possible combinations
Q42: The diagram below shows the demand and
Q44: The diagram below shows the market demand
Q45: If a perfectly competitive industry was suddenly
Q46: <img src="https://d2lvgg3v3hfg70.cloudfront.net/TB5441/.jpg" alt=" FIGURE 12-3 -Refer
Q47: All points on a country's production possibilities
Q48: The administrative agency established to enforce the