Multiple Choice
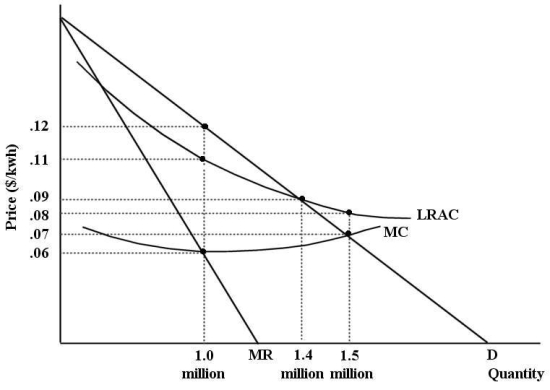
The diagram below shows cost and revenue curves for a natural monopoly producing electricity.Price is dollars per kilowatt hour and quantity is kilowatt hours per day.  FIGURE 12-7
-Refer to Figure 12-7.If this firm were unregulated and profit maximizing,its price and output would be ________ per kwh and ________ kwh per day.
A) $0.08; 1.5 million
B) $0.09; 1.4 million
C) $0.12; 1 million
D) $0.11; 1 million
E) $0.07; 1.5 million
Correct Answer:

Verified
Correct Answer:
Verified
Q1: Suppose your municipality charges your household a
Q3: An important defence of oligopoly as a
Q4: A major aim of Canadian competition policy
Q5: Allocative efficiency occurs when<br>A)producer surplus is maximized.<br>B)consumer
Q6: Consider three firms,A,B and C,all producing kilos
Q7: Allocative efficiency concerns<br>A)producing outputs at lowest possible
Q8: <img src="https://d2lvgg3v3hfg70.cloudfront.net/TB5441/.jpg" alt=" FIGURE 12-3 -Refer
Q9: Canadian governments (federal,provincial and municipal)employ public ownership
Q10: In many cases throughout Canadian history,governments have
Q11: <img src="https://d2lvgg3v3hfg70.cloudfront.net/TB5441/.jpg" alt=" FIGURE 12-3 -Refer