Multiple Choice
The diagram below shows the marginal benefit and marginal cost of a public good.This economy has 3 individuals,A,B and C.The diagram shows the MB for each individual and a summation of their marginal benefits. 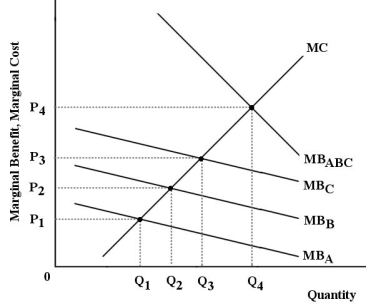 FIGURE 16-4
-Refer to Figure 16-4.The curve MBABC is derived by
A) a vertical summation of the marginal benefits of all individuals at each level of output.
B) observation of the consumption of public goods at a price of zero.
C) observation of the consumption of public goods at the optimal price.
D) a horizontal summation of the marginal benefits of all individuals at each given price level.
E) determining the private marginal cost of the public good.
Correct Answer:

Verified
Correct Answer:
Verified
Q61: In a free-market system,a disequilibrium in one
Q62: The diagram below shows the marginal benefit
Q63: Which of the following proposals could be
Q64: <img src="https://d2lvgg3v3hfg70.cloudfront.net/TB5441/.jpg" alt=" FIGURE 16-1 -Refer
Q65: All Canadian provincial governments have legislated minimum
Q67: Consider a childhood vaccination program that is
Q68: Consider an industry producing good X.The quantity
Q69: Under what circumstances would it be efficient
Q70: Which of the following is the best
Q71: Which of the following statements about the