Multiple Choice
The diagram below shows the marginal benefit and marginal cost of a public good.This economy has 3 individuals,A,B and C.The diagram shows the MB for each individual and a summation of their marginal benefits. 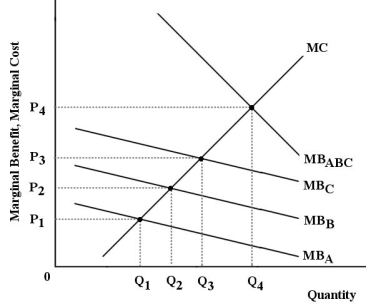 FIGURE 16-4
-Refer to Figure 16-4.Suppose the government provides Q4 units of the public good.If the government was able to require consumers to pay a price of P1,then
A) the market would clear,although not enough would be produced.
B) an inefficient quantity would be being produced.
C) consumers would use too little of the public good,and the outcome would be inefficient for society.
D) consumers would not use the public good at all,and this would be socially optimal.
E) the appropriate price would be achieved,although not enough would be consumed.
Correct Answer:

Verified
Correct Answer:
Verified
Q57: One reason that national defence is a
Q58: The government prohibits individuals from paying someone
Q59: In the context of government intervention in
Q60: Suppose an advertising firm purchases additional insurance
Q61: In a free-market system,a disequilibrium in one
Q63: Which of the following proposals could be
Q64: <img src="https://d2lvgg3v3hfg70.cloudfront.net/TB5441/.jpg" alt=" FIGURE 16-1 -Refer
Q65: All Canadian provincial governments have legislated minimum
Q66: The diagram below shows the marginal benefit
Q67: Consider a childhood vaccination program that is