Multiple Choice
The diagram below shows the marginal cost of pollution abatement for two firms,Firm X and Firm Y. 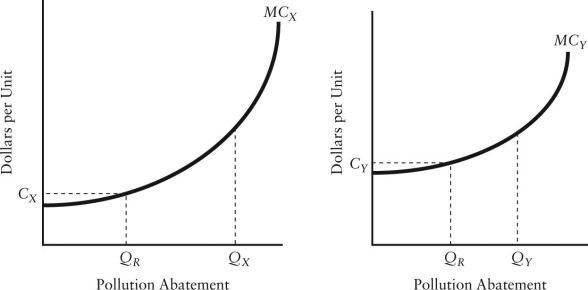 FIGURE 17-4
-Refer to Figure 17-4.Suppose Firms X and Y are each abating QR units of pollution.If Firm X then reduces pollution by one unit and Firm Y increases pollution by one unit,then
A) total pollution remains the same but the total cost of abatement falls.
B) total pollution remains the same but the total cost of abatement increases.
C) the total cost of abatement remains the same but pollution falls.
D) the total cost of abatement remains the same but pollution increases.
E) the total costs of abatement and the amount of pollution do not change.
Correct Answer:

Verified
Correct Answer:
Verified
Q81: Suppose a per-unit tax is imposed on
Q82: Zero environmental damage is probably<br>A)technologically possible and
Q83: A potential disadvantage of emissions taxes versus
Q84: The diagram below shows the marginal costs
Q85: Consider the following equation: GHG = <img
Q87: The table below shows the marginal benefit
Q88: Consider an oil company extracting oil from
Q89: The main advantage of using market-based schemes
Q90: The diagram below shows a market for
Q91: Direct pollution controls can be inefficient because,for