Multiple Choice
The diagram below shows the marginal costs of pollution abatement for two firms,Firm 1 and Firm 2. 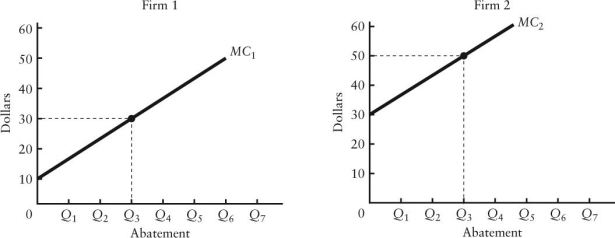 FIGURE 17-5
-Refer to Figure 17-5.If the government requires each firm to abate Q3 units of pollution,the social costs of this abatement
A) would be minimized.
B) could be reduced further if each firm was required to abate more.
C) could be reduced further if Firm 1 increased its abatement and Firm 2 reduced its abatement by the same amount.
D) could be reduced further if Firm 2 increased abatement and Firm 1 reduced its abatement by the same amount.
E) could be reduced further if each firm was allowed to pollute more.
Correct Answer:

Verified
Correct Answer:
Verified
Q79: Direct controls for reducing pollution can be
Q80: Suppose a firm producing roof shingles imposes
Q81: Suppose a per-unit tax is imposed on
Q82: Zero environmental damage is probably<br>A)technologically possible and
Q83: A potential disadvantage of emissions taxes versus
Q85: Consider the following equation: GHG = <img
Q86: The diagram below shows the marginal cost
Q87: The table below shows the marginal benefit
Q88: Consider an oil company extracting oil from
Q89: The main advantage of using market-based schemes