Multiple Choice
The diagram below shows the marginal cost of pollution abatement for two firms,Firm X and Firm Y. 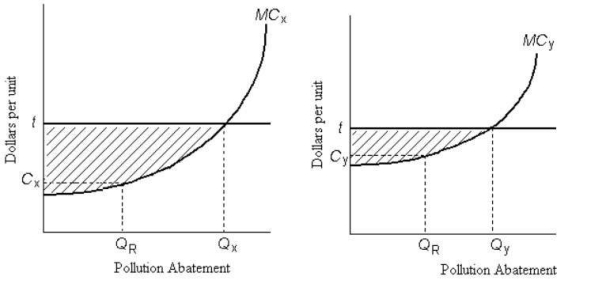 FIGURE 17-6
-Refer to Figure 17-6.Firms X and Y have an emissions tax of $t imposed on each unit of pollution they produce.Firm X will choose to abate pollution of ________ units and Firm Y will choose to abate pollution of ________ units.
A) QR; QR
B) QX; QR
C) QX; QY
D) 0; 0
E) QR; QY
Correct Answer:

Verified
Correct Answer:
Verified
Q47: The diagram below shows the marginal cost
Q48: The diagram below shows a market for
Q49: The marginal benefit of reducing pollution and
Q50: A paper mill discharges chemicals into a
Q51: As a method of pollution control,tradable emissions
Q53: What is the "marginal cost of pollution
Q54: Which of the following environmental problems would
Q55: In a competitive market for tradable pollution
Q56: A paper mill discharges chemicals into a
Q57: The diagram below shows the marginal cost