Multiple Choice
The diagram below shows the marginal cost of pollution abatement for two firms,Firm X and Firm Y. 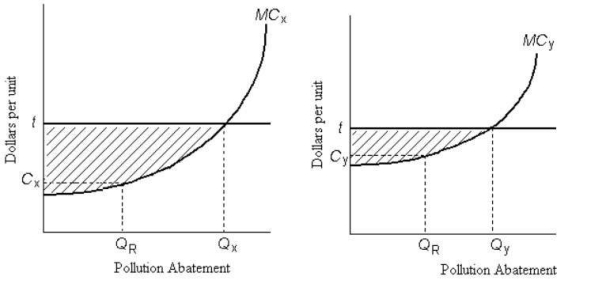 FIGURE 17-6
-Refer to Figure 17-6.There is an emissions tax of $t per unit of pollution.The resulting amount of pollution abatement is socially optimal if
A) Firm X abates QX and Firm Y abates QY.
B) each firm abates at QR.
C) the emissions tax causes no change in firms' polluting activity.
D) the emissions tax is equal to the marginal social cost of pollution.
E) each firm pays the maximum amount of tax.
Correct Answer:

Verified
Correct Answer:
Verified
Q52: The diagram below shows the marginal cost
Q53: What is the "marginal cost of pollution
Q54: Which of the following environmental problems would
Q55: In a competitive market for tradable pollution
Q56: A paper mill discharges chemicals into a
Q58: Consider global greenhouse-gas emissions.Suppose that in 2016,greenhouse
Q59: An important reason that direct controls are
Q60: Between 1995 and 2011,Canada's greenhouse gas emissions
Q61: An emissions tax (imposed on each unit
Q62: The figure below shows the demand and