Multiple Choice
The diagram below shows the marginal costs of pollution abatement for two firms,Firm 1 and Firm 2. 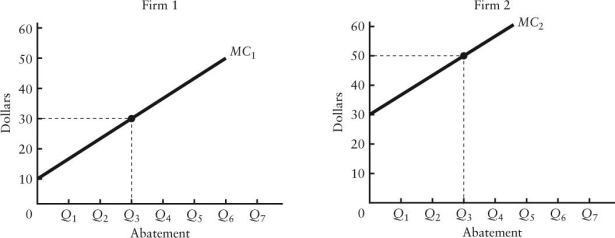 FIGURE 17-5
-Refer to Figure 17-5.Suppose Firm 1 and Firm 2 are each abating Q3 units of pollution.If the government imposes an emissions tax of $20 per unit of emissions,
A) Firm 1 will abate less than Q3,and Firm 2 will not abate any pollution at all.
B) neither firm will abate any pollution.
C) the level of pollution abatement will be optimal.
D) Firm 1 will increase abatement beyond Q3 and Firm 2 will abate less than Q3.
E) Firm 1 and Firm 2 will each increase abatement beyond Q3.
Correct Answer:

Verified
Correct Answer:
Verified
Q108: The table below shows the marginal benefit
Q109: One possible strategy for efficiently addressing the
Q110: Suppose a firm producing roof shingles imposes
Q111: The table below shows the marginal benefit
Q112: Suppose a farm that is polluting an
Q114: The diagram below shows the marginal cost
Q115: The table below shows the marginal costs
Q116: The diagram below shows a market for
Q117: A paper mill discharges chemicals into a
Q118: Suppose a firm producing roof shingles imposes