Multiple Choice
The diagram below shows a market for tradable pollution permits. 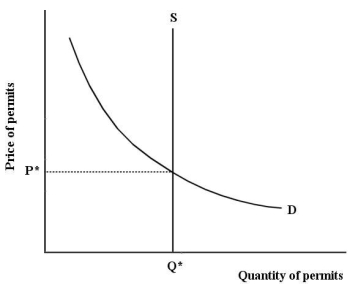 FIGURE 17-8
-Refer to Figure 17-8,which depicts a market for tradable pollution permits.Improvements in firms' abatement technology will be expected to
A) shift the supply curve to the right.
B) shift the supply curve to the left.
C) shift the demand curve to the right.
D) shift the demand curve to the left.
E) not have any impact on the equilibrium.
Correct Answer:

Verified
Correct Answer:
Verified
Q111: The table below shows the marginal benefit
Q112: Suppose a farm that is polluting an
Q113: The diagram below shows the marginal costs
Q114: The diagram below shows the marginal cost
Q115: The table below shows the marginal costs
Q117: A paper mill discharges chemicals into a
Q118: Suppose a firm producing roof shingles imposes
Q119: Consider the following equation: GHG = <img
Q120: All of the following are examples of
Q121: When a farmer in Manitoba produces fertilizer