Multiple Choice
The diagram below shows supply and demand diagrams (S and D) for some product.The government then imposes an excise tax.The new supply curve is  .
. 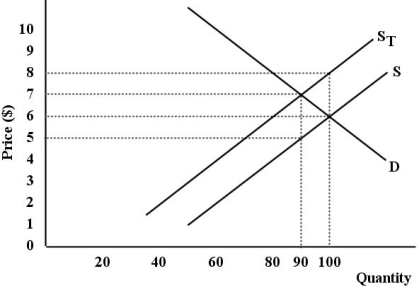 FIGURE 18-4
-Refer to Figure 18-4.What is the producers' net revenue after the imposition of the tax?
A) $450
B) $500
C) $540
D) $600
E) $630
Correct Answer:

Verified
Correct Answer:
Verified
Q47: The most important source of revenue for
Q48: The figure below show a simplified version
Q49: The various provincial sales taxes are mildly
Q50: An income tax is progressive if,as income
Q51: Which of the following statements about the
Q53: If there were "horizontal equity" between all
Q54: The table below shows 2015 federal income-tax
Q55: The table below shows 2015 federal income-tax
Q56: Suppose there is only one movie theatre
Q57: Suppose a firm buys $3000 worth of