Multiple Choice
The diagram below shows supply and demand diagrams (S and D) for some product.The government then imposes an excise tax.The new supply curve is  .
. 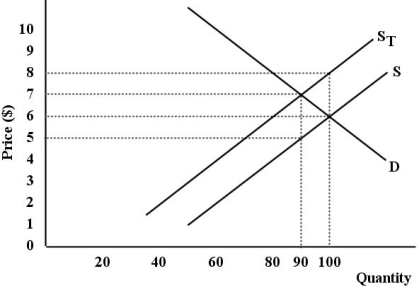 FIGURE 18-4
-Refer to Figure 18-4.What is the value of the tax imposed on this product,in dollars per unit?
A) $1
B) $2
C) $3
D) $4
E) $5
Correct Answer:

Verified
Correct Answer:
Verified
Q58: Suppose there is only one movie theatre
Q59: From the perspective of individuals,the goods and
Q60: <img src="https://d2lvgg3v3hfg70.cloudfront.net/TB5441/.jpg" alt=" FIGURE 18-3 -Refer
Q61: A mandatory health-insurance premium of a given
Q62: The goods and services tax (GST)in Canada
Q64: The figure below show a simplified version
Q65: The figure below show a simplified version
Q66: A "poverty trap" refers to the situation
Q67: Statistics Canada defines the poverty line as
Q68: <img src="https://d2lvgg3v3hfg70.cloudfront.net/TB5441/.jpg" alt=" FIGURE 18-1 -Refer