Multiple Choice
The diagrams below show the import,export,and net export functions for an economy. 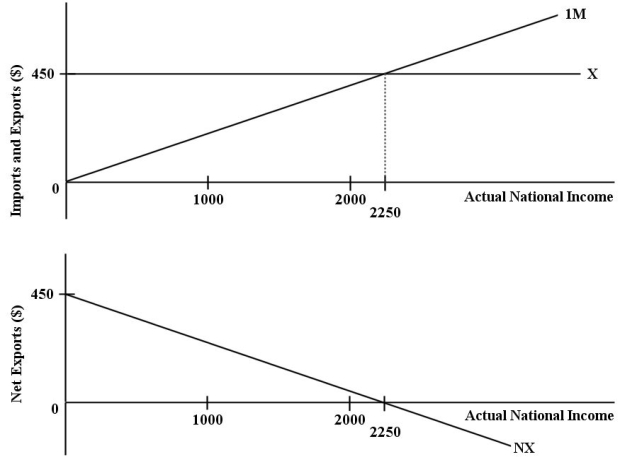 FIGURE 22-1
-Refer to Figure 22-1.The function for desired imports for this economy can be expressed as
A) NX = 450 - Y.
B) IM = 450 - 0.5(Y) .
C) NX = 0.5(Y) .
D) IM = 0.5(Y) .
E) IM = 0.2(Y) .
Correct Answer:

Verified
Correct Answer:
Verified
Q22: Consider the simplest macro model with demand-determined
Q24: Consider the government's budget balance.Suppose G =
Q29: Suppose exports (X)=100,Y=500,and imports are equal to
Q30: The diagram below shows desired aggregate expenditure
Q32: A downward shift and steepening of the
Q33: We would expect real national income to
Q38: Consider the simplest macro model with demand-determined
Q55: Consider the government's budget balance.Suppose G =
Q99: If the price level is taken as
Q119: Consider a consumption function in a simple