Multiple Choice
The diagram below shows desired aggregate expenditure for a hypothetical economy.Assume the following features of this economy:
∙ marginal propensity to consume (mpc) = 0.75
∙ net tax rate (t) = 0.20
∙ no foreign trade
∙ fixed price level
∙ all expenditure and income figures are in billions of dollars. 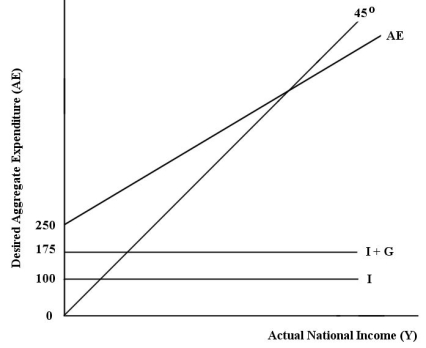 FIGURE 22-2
-Refer to Figure 22-2.What is the marginal propensity to spend (z) in this economy?
A) 0.15
B) 0.20
C) 0.40
D) 0.60
E) 0.75
Correct Answer:

Verified
Correct Answer:
Verified
Q24: Consider the government's budget balance.Suppose G =
Q28: The diagrams below show the import,export,and net
Q29: Suppose exports (X)=100,Y=500,and imports are equal to
Q31: In an open economy with government and
Q32: A downward shift and steepening of the
Q33: We would expect real national income to
Q34: The diagram below shows desired aggregate expenditure
Q38: Consider the simplest macro model with demand-determined
Q55: Consider the government's budget balance.Suppose G =
Q99: If the price level is taken as