Multiple Choice
The table below shows national income and imports.The level of exports is fixed at $300.All figures (in table and questions) are in millions of dollars.
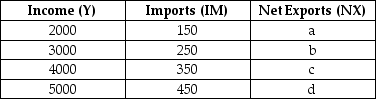 TABLE 22-1
-Refer to Table 22-1.On a graph of the net export function for this economy,at what level of Y would the NX function intersect the horizontal axis?
A) at $0
B) at $2000
C) at $3500
D) at $4000
E) at $5000
Correct Answer:

Verified
Correct Answer:
Verified
Q2: Consider the following news headline: "Government follows
Q47: Consider a simple macro model with a
Q60: Consider the following macro model with demand-determined
Q65: The diagram below shows desired aggregate expenditure
Q66: The diagram below shows desired aggregate expenditure
Q68: Government's transfer payments to individuals affect
Q82: Consider a simple macro model with demand-determined
Q88: In a simple macro model with government
Q89: Consider the government's budget balance.Suppose G =
Q93: Consider the following news headline: "Minister of