Multiple Choice
The diagram below shows desired aggregate expenditure for a hypothetical economy.Assume the following features of this economy:
∙ marginal propensity to consume (mpc) = 0.80
∙ net tax rate (t) = 0.15
∙ no foreign trade
∙ fixed price level
∙ all expenditure and income figures are in billions of dollars. 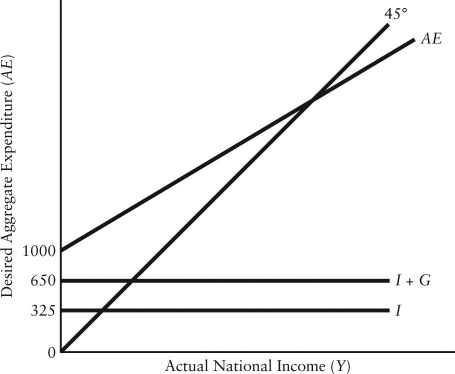 FIGURE 22-3
-Refer to Figure 22-3.What is the level of autonomous consumption?
A) $0
B) $325
C) $350
D) $650
E) $1000
Correct Answer:

Verified
Correct Answer:
Verified
Q2: Consider the following news headline: "Government follows
Q47: Consider a simple macro model with a
Q60: Consider the following macro model with demand-determined
Q64: The table below shows national income and
Q66: The diagram below shows desired aggregate expenditure
Q68: Government's transfer payments to individuals affect
Q82: Consider a simple macro model with demand-determined
Q89: Consider the government's budget balance.Suppose G =
Q93: Consider the following news headline: "Minister of
Q121: Consider a simple macro model with a