Multiple Choice
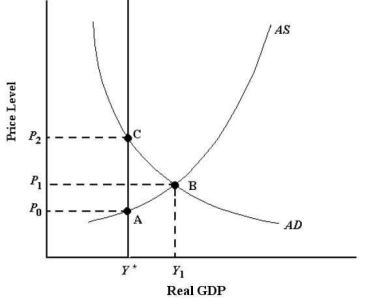 FIGURE 24-2
-Refer to Figure 24-2.Suppose the economy is in equilibrium at Y1.The economy's automatic adjustment process will restore potential output,Y*,through
A) wage increases and a leftward shift of the AS curve.
B) wage increases and a rightward shift in the AS curve.
C) wage decreases and a rightward shift of the AD curve.
D) an increase in potential GDP to intersect both the AD and AS curves at B.
E) a leftward shift of the AD to intersect both the AS and potential GDP at A.
Correct Answer:

Verified
Correct Answer:
Verified
Q24: In our macro model,the level of aggregate
Q26: The diagram below shows an AD/AS model
Q28: The Phillips curve describes the relationship between<br>A)aggregate
Q29: The diagram below shows an AD/AS model
Q32: Income taxes in Canada can be considered
Q36: The diagram below shows an AD/AS model
Q56: Consider the AD/AS model after factor prices
Q67: Suppose the government had made a decision
Q69: In the long run,aggregate demand is _
Q130: In the basic AD/AS macro model,permanent increases